Turning the Invisible Visible
It’s hard to make a decision about something you can’t see.
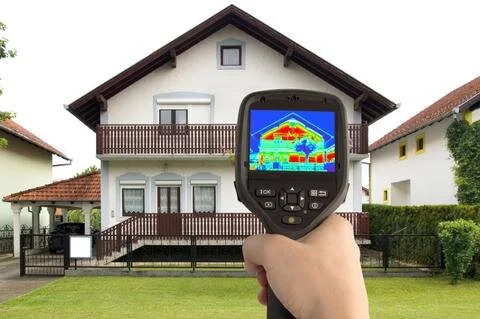
Have you seen those infrared cameras that take images of a building to see where the heat is leaking out? Invisible to the naked eye, but plain as day with the right lens. It’s almost as if money is leaking out the windows and doors, and quite often the building owner isn’t even aware–in fact he might not even know to ask about it until someone shows him the picture.
In the world of retail, the term “leakage” is used to describe the outflow of money when members of a community spend money outside that community. Big companies like Starbucks and Petco learned to measure leakage years ago and use intelligent maps to shape their strategy. Today this technology, known as GIS, is accessible to small businesses and non-profits and it makes invisible patterns visible. It’s a secret weapon that’s changing the way decisions are made.
Maps are a powerful lens that empower business leaders to see leakage along with a lot of other hidden patterns in their marketplace. Spreadsheets, when transformed into maps, show where customers live and how communities spend their money. Interactive maps offer insight into demographics, market potential, and competition. They fit into your pocket on a smartphone for when you’re on the road, and they cover the walls of board rooms where strategy is born.
This is what Datastory does. We reveal hidden information, trends, and opportunities for your business. And we use data you didn’t even know could be meaningful.
Is your datastory invisible or visible?

